- New Home Server
- Installing Proxmox
- Proxmox Quirks & Configurations
- Shiny New DC
- DNS, DHCP, and Redundancy
- Active Directory Structure and Config
- File server replication with Robocopy
- Windows shares on Linux
- Install Plex on CentOS
- Ubiquiti UniFi Controller
- Centreon Monitoring
- Centreon 2 – Electric Boogaloo
In part two of my Centreon setup, I will go over how to add hosts, services, and configure notifications. Once you realize how it works, it seems fairly obvious, but setting up those first few has a little bit of a learning curve. Setting up standard Up/Down monitoring with notifications is just about as easy as you can get, it’s when you want to go further that you need to understand the inner workings a bit more. I made use of NRPE (Nagios Remote Plugin Execution) in order to do things like monitor disk free space, server load, memory usage, etc. You can also do some of these things with SNMP.
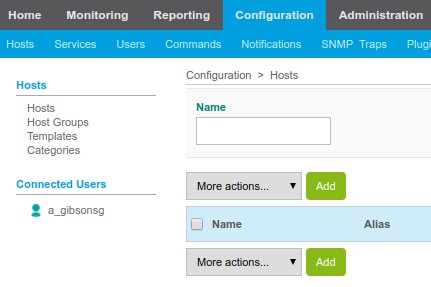
First up, add a host. Do this by navigating to Configuration > Hosts and click the Add button.
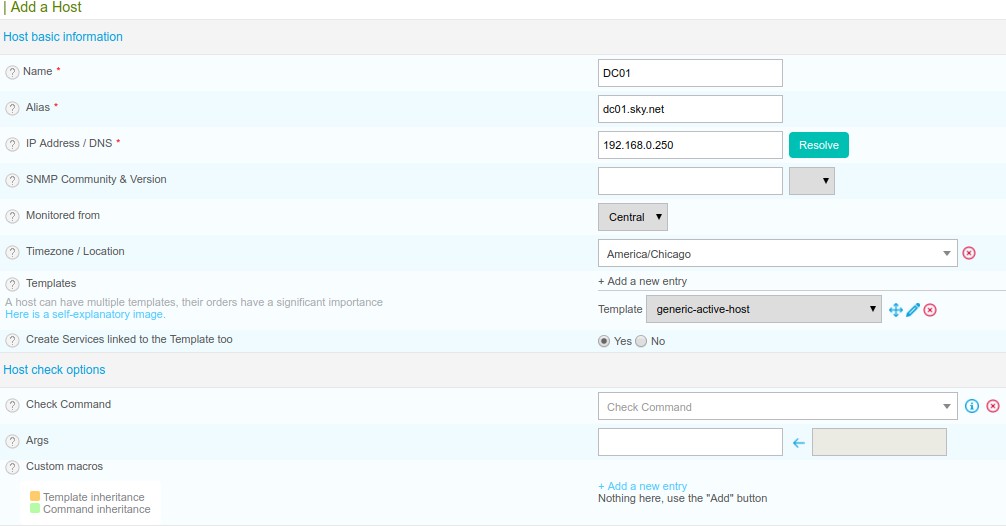
You will need to define a Name, Alias, and IP address. As you’ll see in the below screenshot I prefer to use the server name and FQDN respectively for Name and Alias. You can input the hostname and hit resolve and it will automagically populate the IP address. Monitored from would be the poller that will be used, in my case, I only have the one so it remains as Central. Set your timezone, and then click the +Add new entry by templates and choose generic-active-host. Skip over the host check options section.
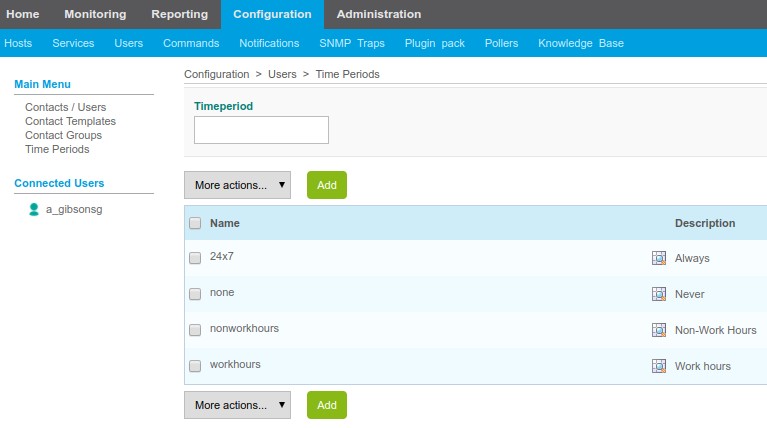
Then you can fill out the scheduling options section. Check period can be 24×7, none, work hours, or non work hours. Those last two can be defined by navigating to Configuration > Users > Time Periods.
Max check attempts is the number of times Centreon will run the check before generating an alert, I tend to set this to 3. The Normal Check Interval is how often the check will be run, I set this to 5 which is just 5 * 60 seconds = 5 minutes. The retry check interval determines how often the host is checked once it has gone into a down/unavailable state. I set this to 1 so that it will check every minute until it is back up. The final two settings are related to the type of checks that can be performed on the host. Active Checks are initiated by the Centreon poller, this is what the majority of your checks will likely be, they’re good for checking things at regularly scheduled intervals. Passive checks are initiated and performed by external applications or processes and the results are then submitted to Centreon for processing, these are primarily used in situations where a regularly scheduled active check just won’t work . A prime example of a use for passive checks is going to be SNMP traps. Once everything has been entered, click save, and you have now created your first host.
That is the bare minimum config that is necessary to get a host entered and begin monitoring. However, you will notice there are 4 other tabs available:
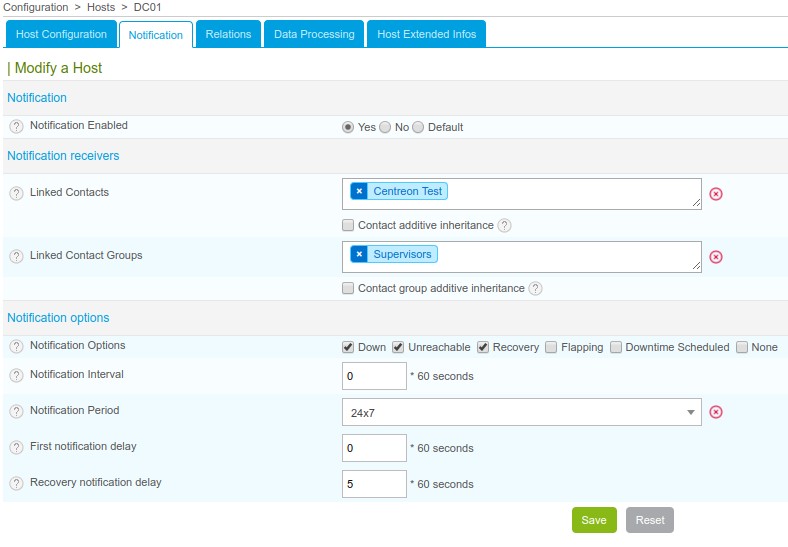
In order to actually get alerts if the host goes down, you either need to configure notifications for it individually on the Notifications tab, or setup a template with the options already configured that can be applied to each host. Then instead of using generic-active-host you could use generic-active-host-custom (or create a new one and name it whatever you want) and quickly apply that to each host to set all your settings.
You will want to enable notifications, and then either directly add a contact, or add a contact group for the alerts to go to. Set your options for what generates a notification. Set the notification interval, I tend to set this to 0, this will send out an alert at each state change. If you sent it to anything else, it’s going to repeatedly alert at each interval whether there has been a change in status or not, until it comes back up. Set the notification period, and the first notification delay. Note that the notification delay compounds with the max check attempts set on the host configuration tab. I.e. if the max check attempts is set to 3, your normal check interval is 5, and the first notification delay is 5 then it would take a total of 20 minutes before you get an alert on a down host. Finally, set the recovery notification delay, I tend to set this to 5 minutes to give the host time to stabilize and make sure it’s not going to bounce anymore before it notifies of Up/Reachable status.
There are a few things that must be set in order to get your email notifications to work. You’ll want to set the address that Centreon sends mail as, you can do this by editing /etc/centreon-engine/centengine.cfg and locating the line:
|
1 |
admin_email=admin@localhost |
and changing it to the email address of your choice. Then you must also configure postfix to be able to properly send mail. Since I’m running this at home, I have mine setup to relay mail through a domain that I own… you could do the same to relay through gmail or some other such service as well. You can find instructions on how to do that in this post. Those instructions are for Debian, but same principles apply: Just replace apt-get with yum and the SASL packages that you will need to install are:
|
1 2 3 4 |
cyrus-sasl-gssapi-2.1.26-20.el7_2.x86_64 cyrus-sasl-plain-2.1.26-20.el7_2.x86_64 cyrus-sasl-2.1.26-20.el7_2.x86_64 cyrus-sasl-lib-2.1.26-20.el7_2.x86_64 |
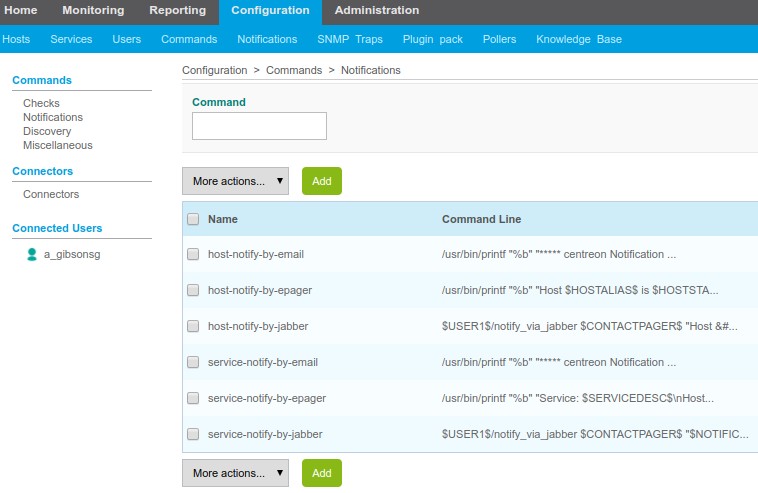
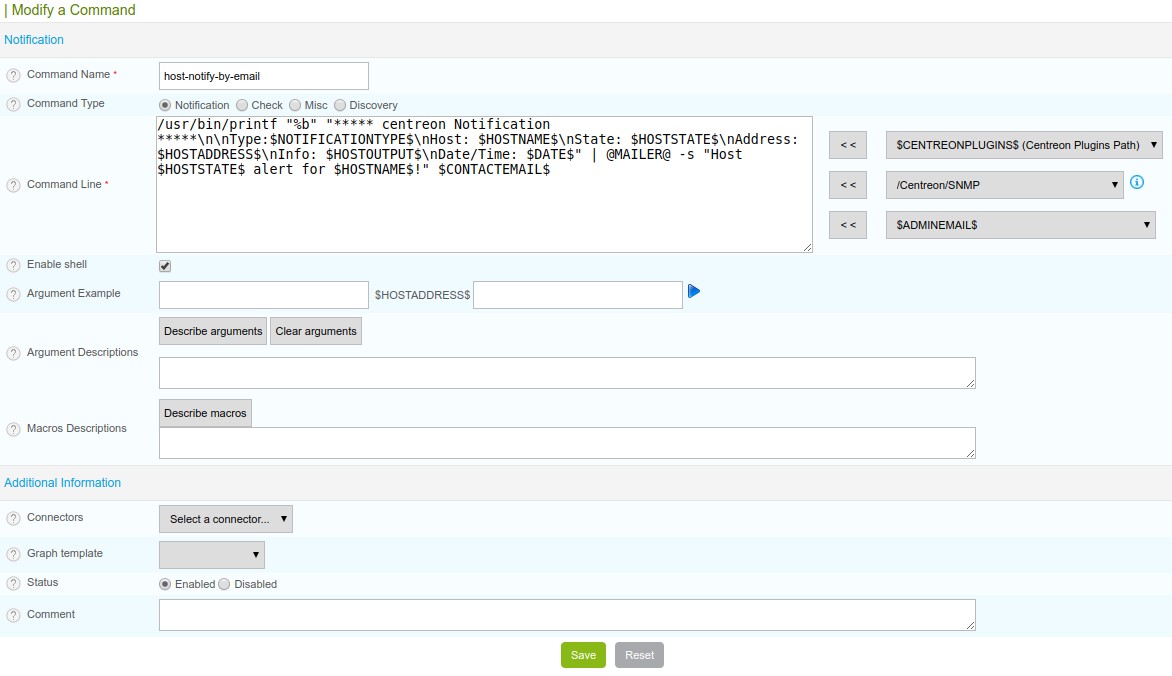
You can edit the format of the outgoing messages by navigating to Configuration > Commands > Notifications where you will find several options. The two to be concerned with are host-notify-by-email and service-notify-by-email.
As you can see, there is a lot of customization that can be done for the notifications that I won’t get into here, I just wanted to make you aware of how to make modifications to the outgoing messages.
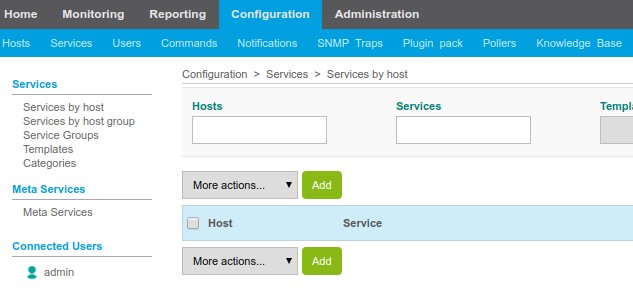
Next up is configuring a service to be monitored, the process is similar, but you do have to configure a check command. Start by navigating to Configuration > Services and clicking the Add button.
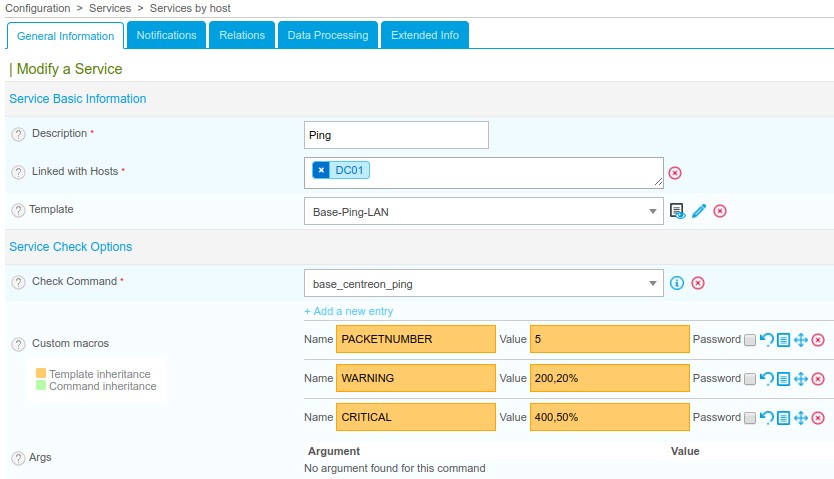
You can define a service, and then link it to multiple hosts to save time and extra configuration. Start off by entering a description, choosing a host(s) to link it with, you can choose a template if there is one already created that will accomplish what you need (I’ll be using the Base-Ping-LAN template in the example because there’s no configuration necessary on the host for it, and it will autofill the Macro fields), and the check command (In this case, base_centreon_ping).
The rest of the setup will be the same as it was for a host, configuring your notifications and intervals, etc.
So there you have it, your first host and service successfully configured in Centreon. Now you will just need to export the configuration and reload the poller as covered in the previous post to get the new configuration to take affect, then give the poller a few minutes to work and you’ll be able to see the status of your newly created host and service. Get there by navigating to Monitoring > Hosts and choosing all in the Hosts Status drop down, or navigating to Monitoring > Services and choosing all in the Service Status drop down respectively.
Alternately, you can create a custom view on the home tab by clicking the pencil icon in the top right corner, and then the Add View button. Give it a name and column layout, check the “Public” box if it you want it to be shared with all Centreon users.
Once you’ve done that, you will get a new set of buttons to customize the view with. 
If there are no widgets in the list when you click the add widget button, you need to download/install some with yum from the shell. To get all available widgets just issue the command:
|
1 |
yum install centreon-widget-* -y |
Then navigate to Administration > Extensions > Widgets and you’ll need to click the gear next to each one in order to install it for use.
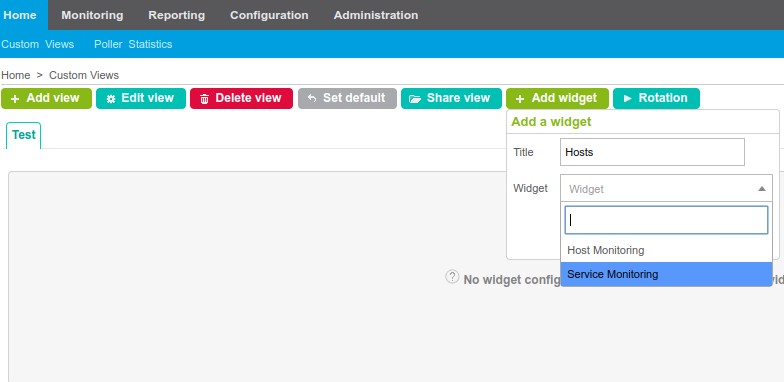
Now you use the Add Widget button on your custom view, type in a name and choose from the drop down list.
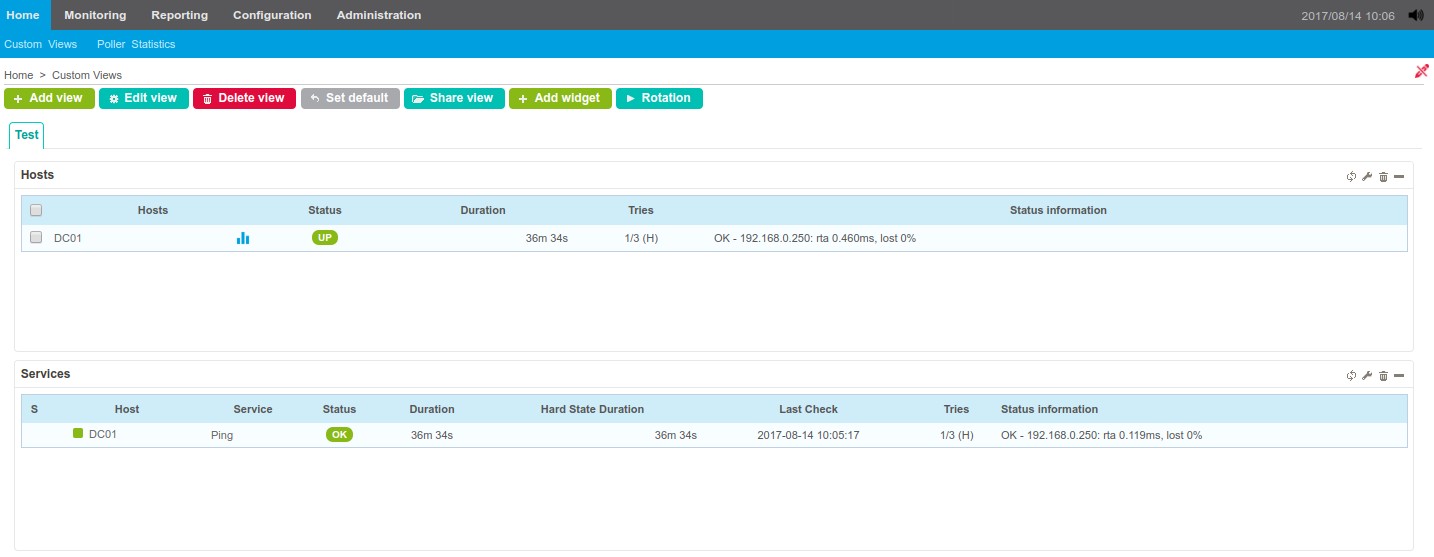
Here’s an example with the Host Monitoring and Service Monitoring widgets added. You’ll notice there is a tiny little wrench icon in the top right corner of each widget, you can click this to configure the settings to do things such as only show down hosts/services, configure which hosts will be shown, etc.
In a separate post I’ll get into configuring NRPE on both Linux and Windows hosts to get some more detailed service information… things like Uptime, Memory Usage, CPU Load, Disk Free space, etc.





sreekand
Hi Lynn,
Thank you for the this wonderful tutorial.
Sreekand